
The new Civo dashboard is in beta: Try it today
Written by

Head of User Experience at Civo
Written by
Head of User Experience at Civo
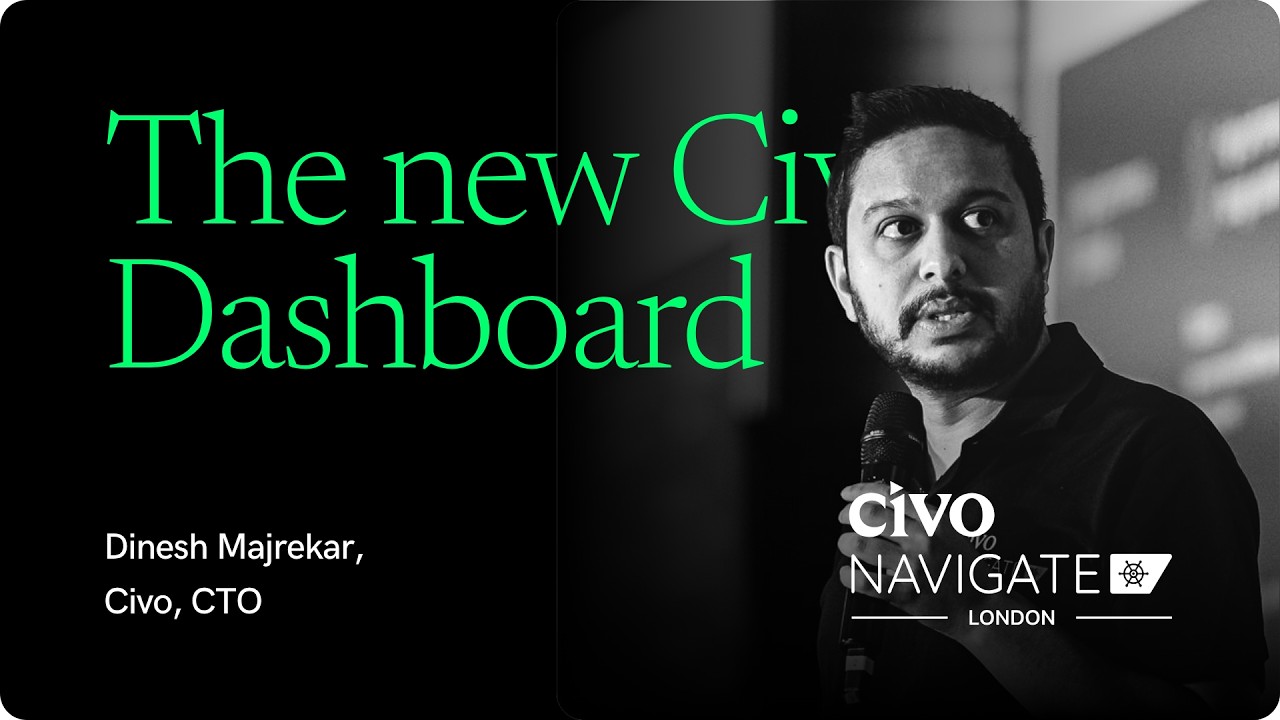
First previewed on stage at Civo Navigate London, the new Civo dashboard is now in beta, and getting to it just got a lot easier.
Starting today, you'll see a Try it now banner at the top of your current dashboard at dashboard.civo.com. Click it to head to the new dashboard, sign in with your usual Civo account details, and you're in. You can also go directly to dashboard-manager.civo.com.

Look for the Try it now banner in your current dashboard.
What's different
We rebuilt the dashboard from the ground up to make everyday cloud management faster and simpler, with one consistent experience wherever your workloads run, whether that's a Civo public cloud region or your own private data center. Everything you rely on today is there, in a cleaner, more modern interface, plus Konstruct built right in.
All your regions in one view
No more switching regions to find what you're running. The new region selector at the top of the page lets you see resources across London, Frankfurt, New York, and Mumbai at once, or filter down to a single region when you need to.

View every region at once, or filter to just one.
Clearer resource pages
Resource lists are easier to scan, with search, status filters, and sortable columns. Networks, for example, now show region, status, CIDR, and nameservers side by side for every region. Object stores show usage, region, URL, and access keys at a glance, and you can open one to see what's inside and upload data.

Networks across every region, on one page.

Object stores with usage, region, and access keys at a glance.
More visibility into your clusters
Kubernetes has had the biggest glow-up. Cluster pages are now organized into clear tabs. Node pools show each pool's health, size, labels, and taints at a glance. Edit a pool to change its node count, with a live check on how many more nodes fit in your quota, and to set labels and taints that steer workloads to the right nodes, such as a specific GPU type, and expand a pool to copy node IPs or recycle nodes in a click.
The Overview tab brings your cluster's total resources and monthly cost, node health, networking, and control plane details together, with quick-connect steps to get kubectl talking to your cluster.

The cluster overview: resources, cost, health, and quick connect.

Edit a pool to scale it and add labels and taints.
New: See what's running inside your clusters
Two brand-new tabs let you see inside your clusters without opening a terminal. The Resources tab lets you browse the deployments, ReplicaSets, secrets, and ingresses running in a cluster, filter by namespace, and search by name. The Events tab shows what's happening in your cluster, filtered by type and time, with warnings such as failed scheduling flagged alongside normal activity. Both make Kubernetes easier to follow, even if you don't live in kubectl.

Browse what's running in your cluster, filtered by namespace.

Cluster events, filterable by type and time.
A rebuilt create flow
Creating a Kubernetes cluster or instance is now a single, guided form with a live summary panel, so you can see pricing as you configure.

The new create cluster flow, with a live summary panel.
A simpler home screen
Your invoice, current usage, and credit balance sit at the top, with one-click shortcuts to deploy a cluster, instance, database, or object store, and your recent activity just below.

Billing, deploy shortcuts, and recent activity at a glance.
Your account, billing, and access, all clearer
Account management got the same treatment.
Quota at a glance
See your usage and limits for compute, VPC, storage, and databases on a single page, and request a quota increase in one click.

Usage and limits for every resource type, in one view.
Billing in one place
Current spend, invoices, and credit history used to live on separate pages. Now they sit together in one billing area, with your credit balance, payment method, and billing address on a single overview. You can also set up email alerts to get notified as you approach your quota limit.

Spend, credit, invoices, and usage alerts together.
Managing Teams
Teams has always let you share access to your Civo account, but it wasn't always easy to see who had access to what, or to set it up quickly.
A redesigned Roles page shows what each role does and how many people hold it. The Teams overview shows every team's members and pending invites at a glance, with quick Invite and Manage buttons on each team. Managing access now takes less time, so there's more time for building.

Managed roles, plus the option to create your own.
New: Konstruct, right in your dashboard
The new dashboard also brings Konstruct into the same place as the rest of your Civo resources. You'll find it in the sidebar, marked New.
Konstruct by Civo is a GitOps-powered internal developer platform that gives you a production-grade platform-as-a-service, deployed in minutes. It brings together infrastructure provisioning, GitOps workflows, secrets management, and certificate automation, and your platform lives in a Git repository you own on GitHub or GitLab, with no lock-in.
Getting started takes three steps: connect your Git organization, configure your platform, and register your app repos to build and ship with GitOps best practices baked in.

Launch Konstruct straight from the sidebar.
Built for what's next
This is just the beginning. From here, every new feature lands in the new dashboard first, starting with Konstruct and the new Resources and Events tabs. Compute users, keep an eye out, because something's on the way.
It's a beta, so you may spot the odd rough edge. If you need to, use Back to old dashboard in the sidebar, or go to dashboard.civo.com, to return to the classic view.
The new dashboard is still in beta, and your feedback will shape where it goes from here. Try it out and let us know what you think using the Feedback button in the dashboard.
Want to get more involved?
Chat to our UX team and share how you work and what you'd like to see next, and help us make Civo even better.
A huge thank you to everyone who helped bring the new dashboard to life. We can't wait to show you what's next.

Head of User Experience at Civo
User experience designer with a passion for solving complex problems through simple and intuitive designs.
Share this article
