
Operating Kubernetes can be a challenge with the number of issues that can occur when deploying workloads. Whilst at Civo Kubernetes we aim to ease provisioning and maintaining your Kubernetes clusters, your workloads are something that need to be controlled and monitored yourself.
What is Komodor?
The Komodor platform makes it easy for you to troubleshoot your workloads running on a Kubernetes cluster, whether on Civo or elsewhere. It helps you monitor your entire Kubernetes stack and helps you uncover root causes of issues.
In this tutorial, I will show you how you can connect a Civo Kubernetes cluster to the Komodor platform, get real-time visibility, and troubleshoot your issues faster.
Prerequisites to installing Komodor
To follow along, make sure you have the Civo CLI installed and set up so you can create a cluster. You will also need kubectl for your operating system so you can manage your cluster. In order to connect your cluster to Komodor, you will also need to install helm.
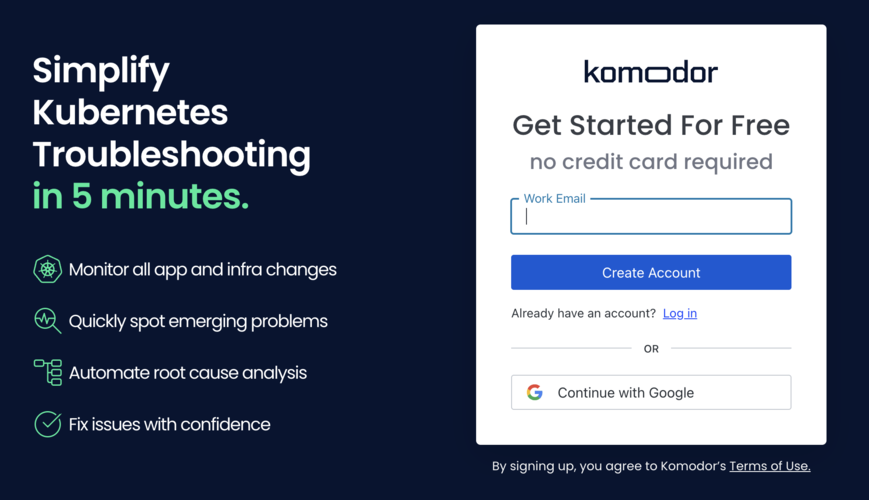
For Komodor, You can go to the Komodor sign up page and get started for free without needing a credit card.
Cluster creation
The following Civo CLI command will create a 5 node cluster named komodor-demo:
$ civo k3s create komodor-demo --nodes 5 --size g4s.kube.large --wait
The cluster komodor-demo (6d1c4808-aef9-4e4c-b736-d1bf7e4da4e3) has been created
We will need to get the Kubeconfig for the cluster and save it to our desired location. If you do not specify a path, it will save it to the default location of ~/.kube/config. In the example below I am specifying a custom path.
$ civo k3s config komodor-demo --save --local-path /Users/saiyam/civo/komodor.config

Access your cluster with:

KUBECONFIG=/Users/saiyampathak/civo/komodor.config kubectl get node
Let's make sure that kubectl knows to use our cluster's configuration file:
$ export KUBECONFIG=/Users/saiyam/civo/komodor.config
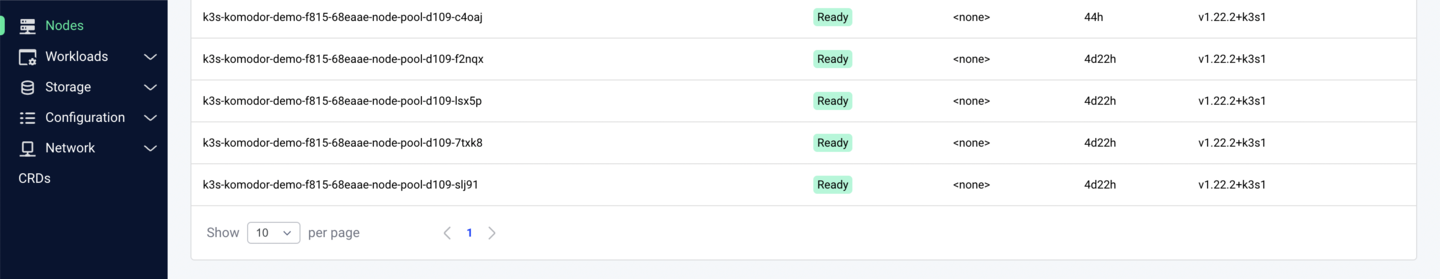
$ kubectl get nodes
NAME STATUS ROLES AGE VERSION
k3s-komodor-demo-f815-68eaae-node-pool-d109-f2nqx Ready <none> 17m v1.22.2+k3s1
k3s-komodor-demo-f815-68eaae-node-pool-d109-slj91 Ready <none> 16m v1.22.2+k3s1
k3s-komodor-demo-f815-68eaae-node-pool-d109-7txk8 Ready <none> 16m v1.22.2+k3s1
k3s-komodor-demo-f815-68eaae-node-pool-d109-gcrhx Ready <none> 17m v1.22.2+k3s1
k3s-komodor-demo-f815-68eaae-node-pool-d109-lsx5p Ready <none> 17m v1.22.2+k3s1
Connecting Civo to Komodor
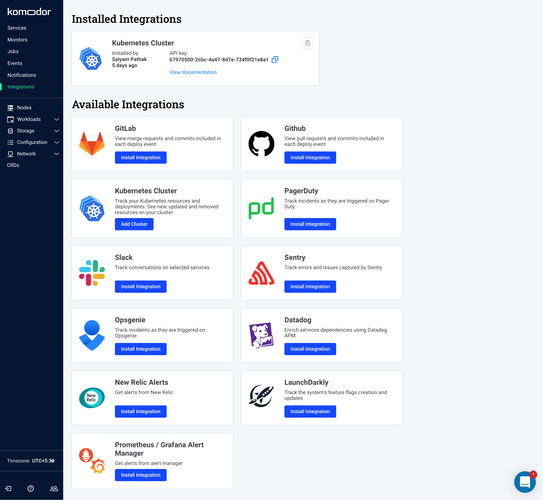
Now in order to use the power of Komodor you need to integrate Civo Kubernetes and Komodor by installing an agent onto the cluster through which Komodor will be able to capture all the metrics and present it.
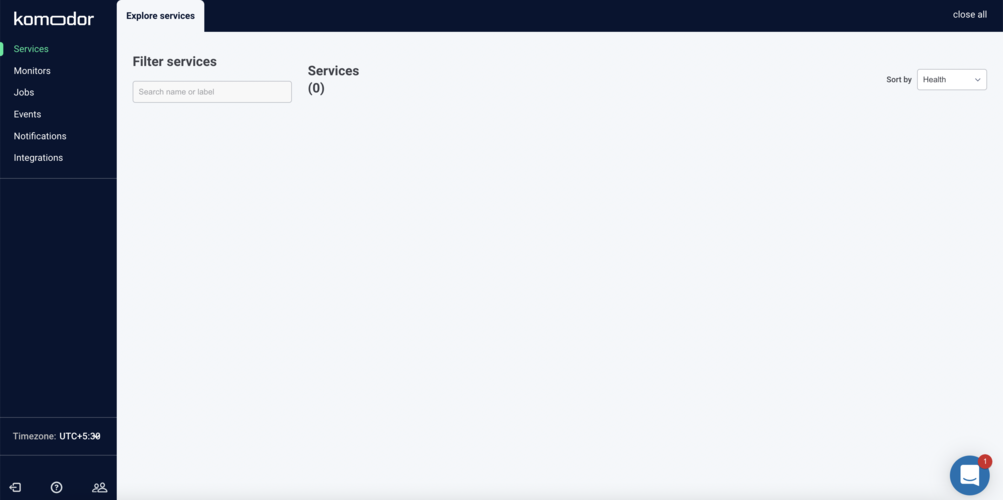
This is the initial screen after you log in.
Navigate to the Integrations tab and choose Kubernetes.

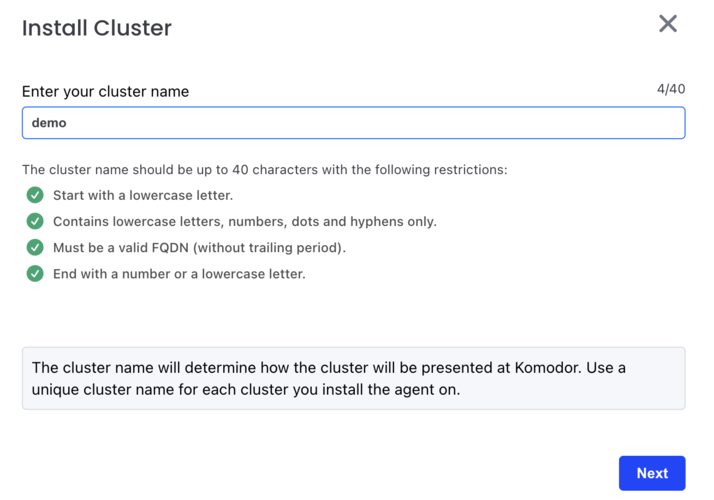
Give a name for the cluster connection:
You will be shown a command that you would need to run on the komodor-demo cluster. It will look a bit like the following:
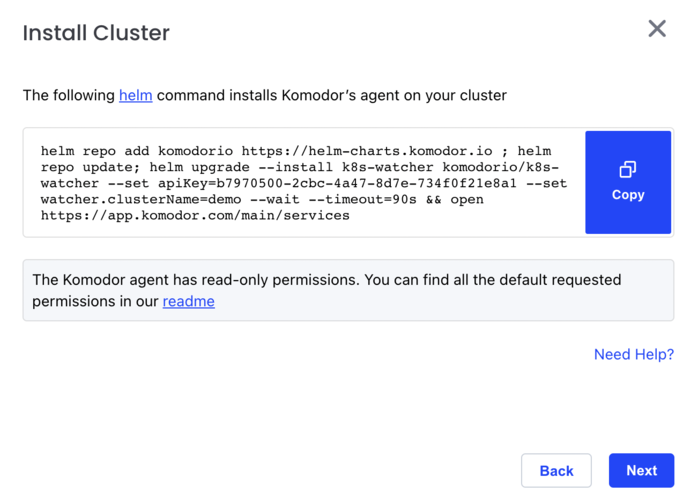
Once you run the command, you will be able to see the agent installed onto the cluster, and the services(Kubernetes workloads) start appearing in the Komodor dashboard
$ kubectl get pods -n komodor
NAME                          READY   STATUS    RESTARTS   AGE
k8s-watcher-d6db8cd8c-4hz2b   1/1     Running   0          52s
Komodor Features
There are various Komodor features that you can use to troubleshoot your workloads and get to the root cause faster. Let's look at them one by one.
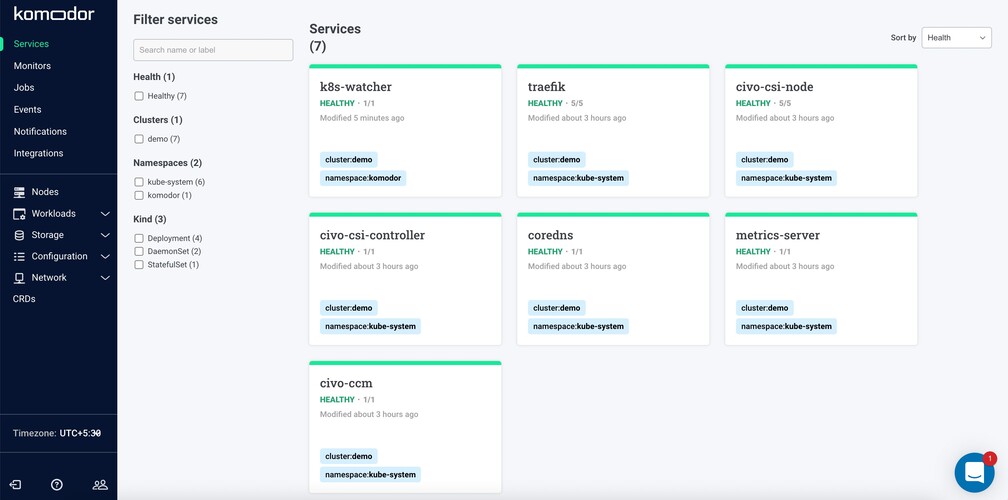
Services view
Komodor services are the workloads running in your cluster and you can filter them by clusters/namespace etc.
Let's create a deployment with the wrong image to see what happens. We are intentionally supplying an incorrect image name here:
$ kubectl create deploy nginx --image=abcd
deployment.apps/nginx created
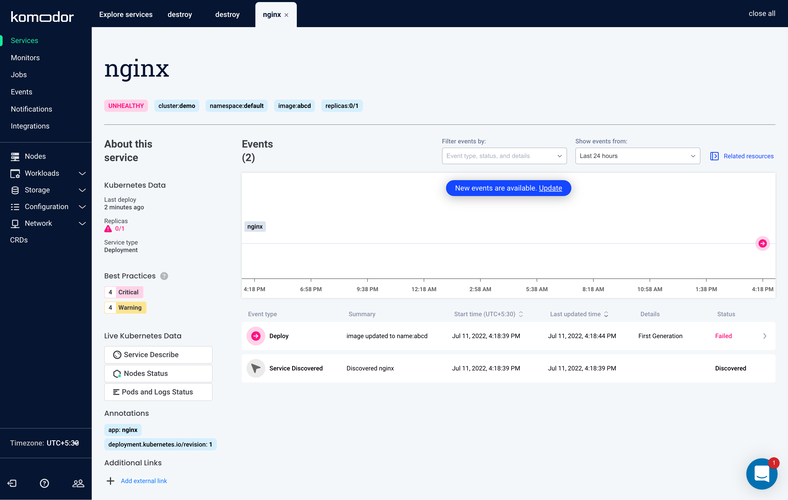
On the dashboard we will be able to see a timeline that depicts the series of events regarding the deployment we just created. This can be really useful when defining your SLAs (service level agreements) and minimizing troubleshooting hours. It tells you the time when something started failing, due to which change and for how much time. You can also zoom in onto the timeline and see various events:
Timeline and summary view
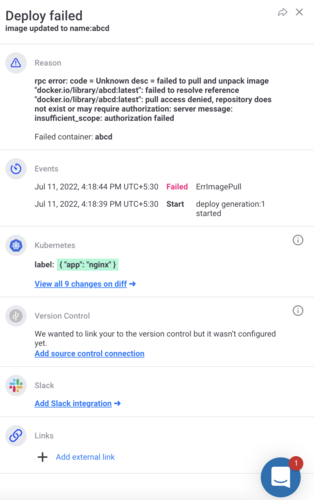
On the timeline view, you can click on the events and see a summary view, which can help you understand what the issue was, and even shows a record of what changed, or a code diff.
You can also add external links, and connect Slack for notifications with just a few clicks.
In this case, you should be able to see from the events that the error is ErrImagePull as we gave the wrong image. In comparison to more typical Kubernetes troubleshooting, you do not have to interact with kubectl at all in order to find out what the issue is.
Let's fix this image and see what happens to the timeline and summary. In your terminal:
kubectl set image deployment/nginx abcd=nginx
deployment.apps/nginx image updated
Now, over on the Komodor side, when we zoom in on the timeline you can see it's green.
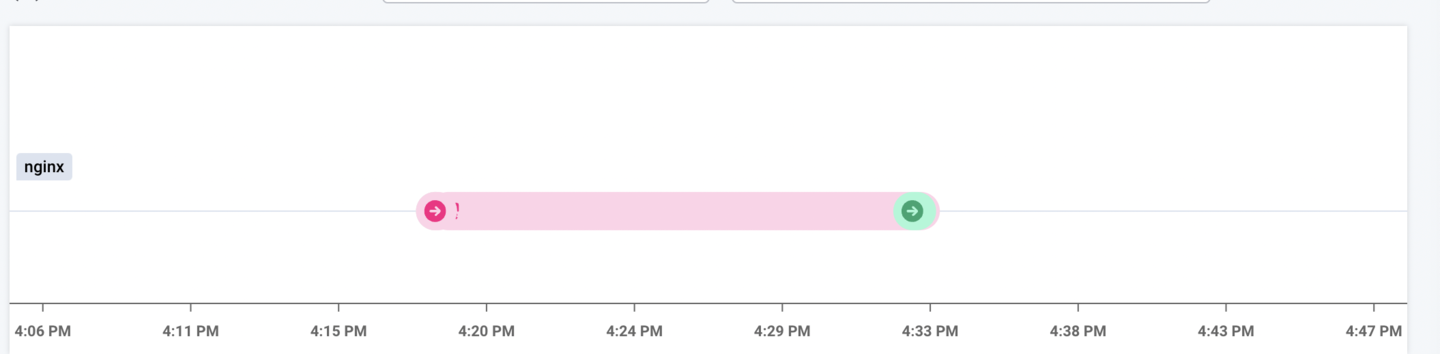
When we click on the green event to view the summary, it will show what changed in it.
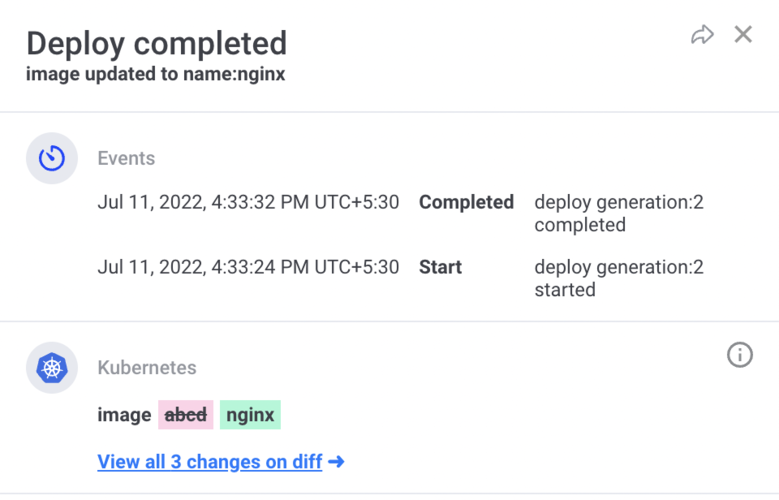
This is the power of timeline and summary view.
Quick view
In addition to these, in the services tab itself, you can describe the deployment, see pod logs and events directly from Komodor.

Monitors
Monitors in Komodor are fairly new at the time of writing this article. This is a series of playbooks that run against your clusters for various monitors and then can alert you based on different conditions. In order to test monitors, first let's create a naughty deployment that will force a node to go into a not-ready state.
Save the following YAML file on your machine.
apiVersion: apps/v1
kind: Deployment
metadata:
  labels:
    project: destroy
  name: destroy
  namespace: memory-pressure
spec:
  replicas: 55
  selector:
    matchLabels:
      app.kubernetes.io/name: destroy
  strategy:
    rollingUpdate:
      maxUnavailable: 0
  template:
    metadata:
      labels:
        app.kubernetes.io/name: destroy
    spec:
      containers:
        - name: node-destroyer
          image: polinux/stress
          command: ["stress"]
          args: ["--vm", "1", "--vm-bytes", "500M", "--vm-hang", "120000", "--verbose"]
      nodeSelector:
        kubernetes.io/hostname: k3s-komodor-demo-f815-68eaae-node-pool-d109-gcrhx
After applying this yaml file onto the cluster using kubectl apply -f filename, will keep on creating pressure and the node will go into a not ready state many times. Leave it for some time so that you get the real benefit from the timeline view.
After some time, this is what the timeline view should look like:

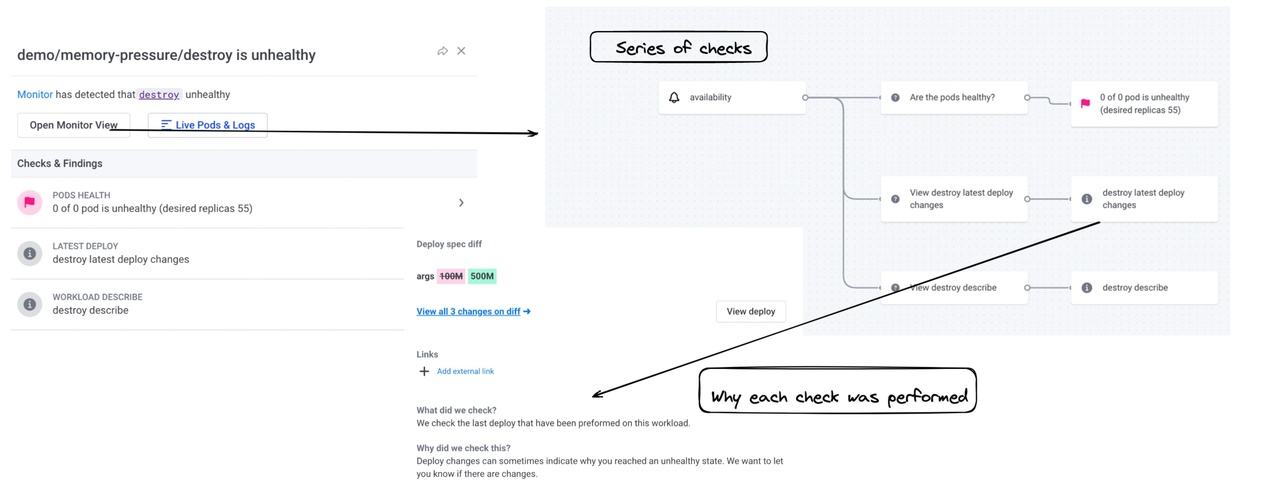
When you click on some of the events you can also see "Open Monitor view". These are a set of automated playbooks that runs a series of checks against various resources like Deployments and Nodes and can give you more rich information about what happened. It also tells you why those checks were done in the first place to educate you.
Availability monitor (deployment availability):
Node monitor:

You can see the number of checks for each monitor with the description of what was these monitors check and how that was achieved.
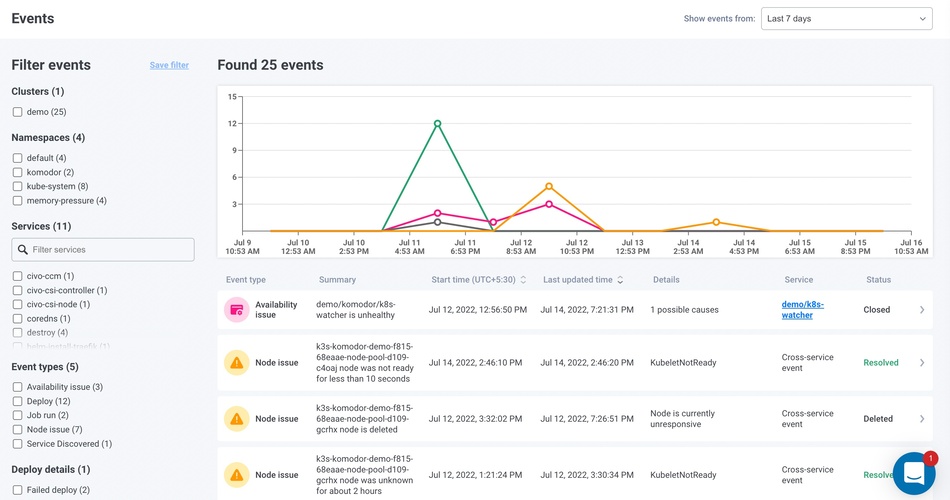
Events
You can also see a complete history of events as a timeline and the issues occurred. You can also filter them based on various parameters such as namespaces, clusters, etc.
Other features
You can add integrations from the integrations tab and integrate commonly-used tools like PagerDuty and Slack to get notifications and the like.
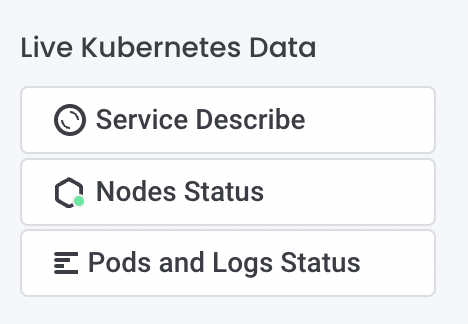
You can get a view of your cluster nodes, workloads, services and all the Kubernetes objects to get a minimal Kubernetes dashboard-type view from within Komodor. This saves you the trouble of going to the command line or any other UI.

You can set the timezone according to your location, so that you can see when the events occurred with regard to your timezone.
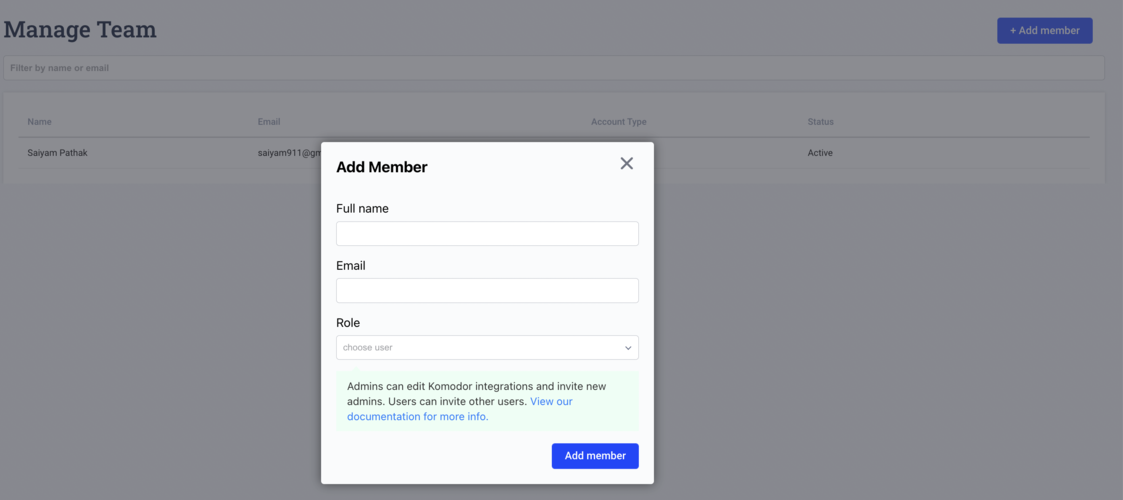
You can add team members and share links to Komodor events with them. These links will open to display the event the same way as it looks to the other team member, wherever they are in the world. This makes troubleshooting easier when you are working remotely and debugging together.
Wrapping up
Komodor gives you helpful debugging functionality as soon as you configure it to watch your cluster. You can view event timelines and diagnose configuration changes with the stored diff of the change, allowing you to arrive to a much more rapid conclusion of what the cause of the issue was. New features such as the monitor playbooks, and integration with alerting systems such as Slack or PagerDuty, mean your cluster management may well be made smoother by using it.
For more information on how you can use Komodor, check out our YouTube channel where we take you on a tour of Komodor and tell you how it can help with your Kubernetes troubleshooting.
If you give Komodor on Civo a try, let us know on Twitter!


